On behalf of the Ohio Public Employees Retirement System (OPERS or System) Board of Trustees, management and staff, it is our pleasure to present this 2016 Popular Annual Financial Report for the fiscal year ended December 31, 2016. Our theme of Dedicated captures the efforts and diligence we display every year.
As the largest public pension system in Ohio, and the 12th largest in the United States, OPERS remains strong. The past year was a good year for the System with positive results, as reported, and progress toward our long-term goals. We are dedicated to continue building financial stability, maximizing operational efficiency, maintaining a responsible investment policy, providing transparent communication and strong educational opportunities for members and stakeholders and continuing to anticipate and prepare for the future.
 Karen E. Carraher, CPA
 Jennifer H. Starr, CPA

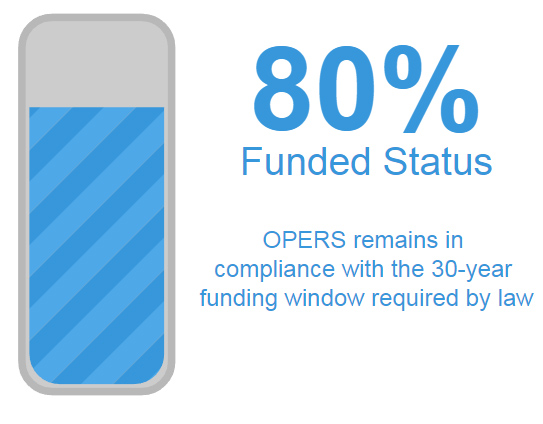
Funded status measures the progress of accumulating the funds necessary to meet future obligations. Historically, periods of diminished funded status were made up as market conditions improved. Similarly, years of enhanced funded status are eroded when market conditions are poor.
We are dedicated to maintaining and enhancing the stability of this System. As a result, OPERS has remained in compliance within the 30-year funding window required by law.
The December 31, 2016 valuation shows a funded status of 80.1%, with the unfunded liability expected to be funded within 19 years. These results reflect the changes in assumptions from the experience study completed in 2016 which reduced the actuarial assumed rate of return, or discount rate, from 8.0% to 7.5%.

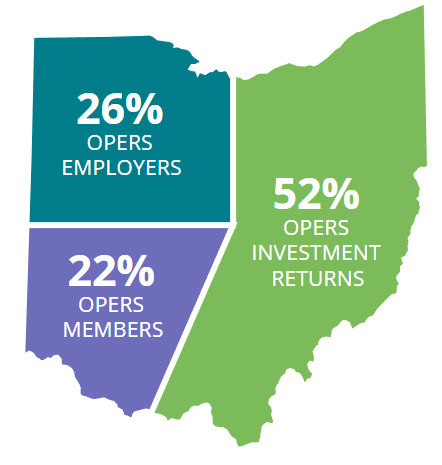
For those retiring in 2016, 74% of the lifetime pension is funded by employee payroll deductions and investment income. The remaining 26% is funded by employer contributions. For every dollar paid by employers, the Ohio economy realized a direct return of $3.49.
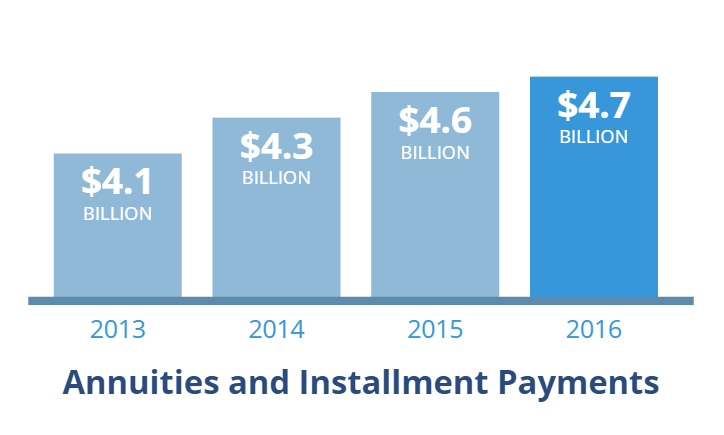
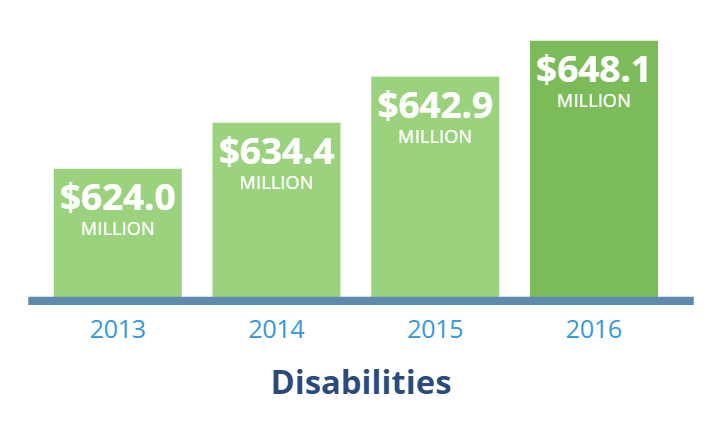
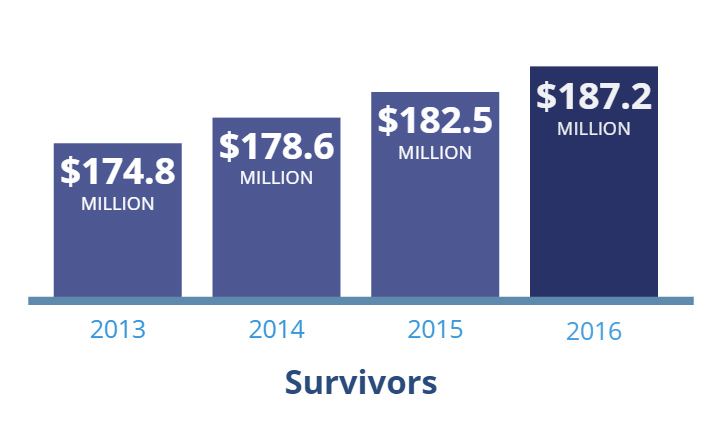
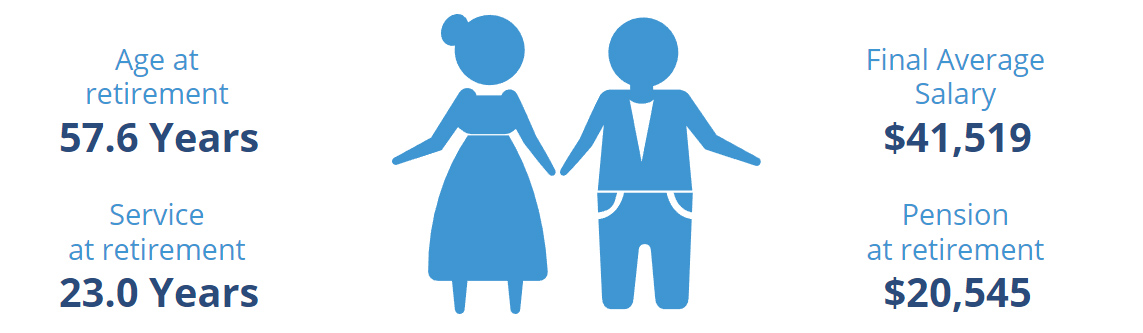
The graphic below shows the average benefits paid to retirees receiving a benefit under the Traditional Pension Plan.
The cost of retirements will continue to increase as new retirees with higher final average salaries replace long-time retirees with lower final average salaries and as members continue to work longer.

Investment markets have become increasingly complex and market volatility can be remarkable. Investment returns provide approximately two-thirds of pension funding, so we must be diligent in our adherence to the principles of asset allocation and diversification to produce solid results.
For the past decade, OPERS has been repositioning the investment portfolio to protect against volatility. Specifically, this involved a reduction in the allocation to public global equities to a more diversified portfolio with improved risk balance. The departure from a portfolio heavy in global equities reduced some of the high results that we might have earned when the equity market was favorable. However, the rebalancing reduced portfolio risk since this asset class also tends to be a key contributor to market volatility.
The Total Investments Summary relates to the System-wide investments and includes the assets of all three portfolios.
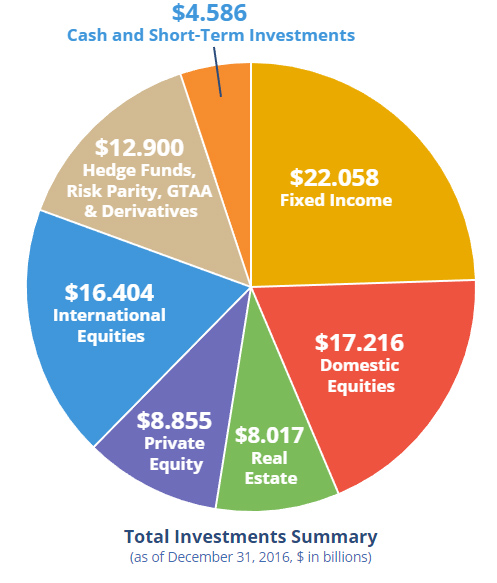
The 2016 investment results were favorable and showed consistent, steady growth.
The OPERS pension return for 2016 was 8.23%, better than the anticipated 7.5% return projected for our funding plan, but lower than the benchmark return of 8.53%. OPERS' total portfolio is made up of underlying portfolios that fund pension benefits and the health care program.

In 2016, more than 389 in-person seminars were offered to OPERS members and retirees throughout the state.
Kevin Blann, OPERS educator, said this about helping members achieve a secure retirement, "It’s a group effort; wherever our members are located in Ohio, OPERS’ educators are there explaining changes to pension benefits and health care. We know our members rely on the information we provided to make confident decisions about their retirement future."
As the largest public pension system in Ohio, and the 12th largest in the U.S., OPERS is a significant economic driver for the state. The majority of our one million members and retirees live and work in Ohio, providing economic stability throughout the state.
For every dollar received by OPERS from public employers in 2016, $3.49 is returned to the economy through pension and health care payments made to retirees— retirees who spend the majority of retirement proceeds on goods and services within the state.


This Popular Annual Financial Report is derived from information contained in the OPERS Comprehensive Annual Financial Report (CAFR) for the year ended December 31, 2016, but does not contain detailed financial information by plan, nor is it presented in a manner to conform to Generally Accepted Accounting Principles (GAAP).
For a complete set of financial definitions included in this summary report please refer to the OPERS CAFR, which is prepared in conformity with GAAP and may be obtained by visiting our website, opers.org, or by contacting OPERS to request a copy.
Download a complete, printable copy of the 2016 PAFR